These surveys are conducted amongst a sample of 2 000 SA adults from the seven major metropolitan areas of South Africa, interviewing them face-to-face in their homes, with a margin of error of under 2.5%. The latest reading was taken in June 2008.
How does the President fare?
The June 2008 reading shows a continued decline in the President's approval rating, from 37% in April to 32% in June, the sharpest drop since the September 2007 drop of 14 points.
For three years - from 2000 to 2001 - the President's approval rating lay generally in the low 30s. But, from February 2003, the percentage of people who felt that President Mbeki is doing a good job as President began to rise. By the end of 2003, it was in the low 40s. 2004 saw a remarkable rise with the Ten Years of Democracy celebrations and the successful second democratic elections. 2005 scaled new heights for the President, during which his approval score averaged 61%, up three points from his 2004 average of 58%. In 2006, after the fourth consecutive fall (to 54% in February) from his high of 66% in April 2005, his approval rating staged a recovery back to 61% but had dropped to 54% by year end. This level was maintained until June 2007. The September reading showed a dramatic drop of 14 points to 40%, the lowest since April 2003.
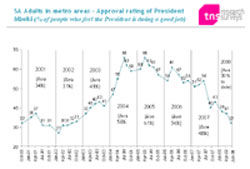
SA Adults in metro areas - Approval rating of President Mbeki
click to enlarge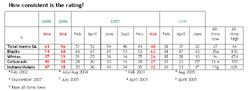
How consistent is the rating?
click to enlarge
- The scores for metro blacks were fairly consistent throughout 2005 but dropped notably in February 2006, recovering in April. They ended 2006 at 69%. The score now at 43% is the lowest since early 2003 and is considerable down on the 65% this time last year.
- The scores amongst whites have been consistently in the mid 30s in recent years until the end of 2006 when they dropped to 26%. They were more volatile in 2007 dropping to a low of 14% (the lowest since 2002) before recovering in November to 25%. The February reading dropped back to 18% and is now at 10% - rivaling its previous all-time low of 9% in February 2001.
- The coloured sample has reached a new all-time low after a previous all-time low in September 2007.
- The Indian/Asian sample is more volatile but also reached a new all-time low of 9%.
Analysis by area shows that, in June 2008, support for the President was highest in East London (76%) and lowest in Durban and Cape Town. Red arrows below indicate significant drops since April.
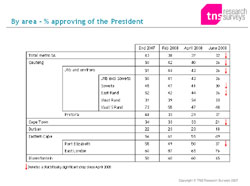
By area - % approving of the President
click to enlarge
The President's approval rating showed strong differences by black language groups:
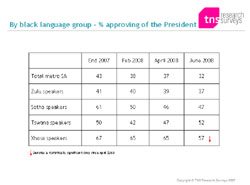
By black language group - % approving of the President
click to enlarge
And how is Jacob Zuma perceived as President of the ANC?
In February, April and June 2008, TNS Research Surveys also asked people whether they felt that Jacob Zuma is doing a good job as President of the ANC. In metro areas, 37% felt that he is doing a good job, this not changing significantly from the 36% recorded in the two initial surveys. However, the proportion of people giving a “don't know” response dropped from the mid-20s of the first two studies to 19% in June. After a period of beginning to warm to Mr Zuma, whites in particular have swung more firmly into a negative stance towards him.
- “Is Jacob Zuma doing a good job as President of the ANC?”
- Yes - 37% (36% in April and 36% in February)
- Blacks - 52% (50% in both April and February)
- Whites - 9% (16% in April and 8% in February)
- Coloureds - 11% (6% in April and 11% in February)
- Indians/Asians - 13% (12% in April and 18% in February)
- No - 44% (40% in April and 38% in February)
- Blacks - 25% (26% in April and 21% in February)
- whites - 79% (51% in April and 72% in February)

- Coloureds - 76% (78% in April and 71% in February)
- Indians/Asians - 71% (67% in April and 58% in February)
- Don't know - 19% (24% in April and 26% in February)
- Blacks - 22% (24% and 28% in February)
- Whites - 12% (33% in April and 20% in February)

- Coloureds - 13% (15% in April and 18% in February)
- Indians/Asians - 16% (21% in April and 30% in February)
Black males show the highest approval rating at 58%, with black females lower at 46%. Jacob Zuma's approval rating as President of the ANC also drops off markedly for those aged 50 years and over. Regional differences are notable, with the Eastern and Western Cape showing exceptionally low approval figures, and Durban and the inland areas showing the highest. However, 46% of people do not approve of either man, 15% approve of both, 17% only approve of the Mr Mbeki and 22% only approve of Mr Zuma.
Total metro SA - 37% approve (36% approved in both April and February)
- Gauteng - 43% approve (44% in April and 41% in February)
- Johannesburg and environs - 46% (45% in April and 42% in February)
- Johannesburg excluding Soweto - 40% (32% in April and 34% in February)
- Soweto - 46% (62% in April and 46% in February)
- East Rand - 51% (53% in April and 46% in February)
- West Rand - 49% (43% in April and 33% in February)
- Vaal Triangle and South Rand - 45% (41% in April and 51% in February)
- Pretoria - 31% (41% in April and 36% in February)
- Cape Town - 18% (14% in April and 17% in February)
- Durban - 46% (47% in April and 50% in February)
- Eastern Cape - 14% (10% in both April and February)
- Port Elizabeth -13% (6% in April and 11% in February)
- East London - 16% (18% in April and 7% in February)
- Bloemfontein - 50% (40% in April and 48% in February)
Jacob Zuma's approval rating showed some differences by black language groups:
-> Zulu speakers - 63% (64% in both April and February)
-> Sotho speakers - 46% (44% in April and 50% in February)
-> Tswana speakers - 54% (53% in April and 44% in February)
-> Xhosa speakers - 38% (28% in April and 31% in February) 
Our take-out
The President's approval rating as President of South Africa dropped sharply to 32% in the June 2008 reading, reaching its lowest level since mid-2002. This fall has been across all race groups with the Eastern Cape and Pretoria being the only areas to show any resilience.
Jacob Zuma's approval rating as President of the ANC is also still quite low but the proportion of people sitting on the fence is beginning to drop. Approval levels are low for whites (who, after a period of warming towards him, have begun to see him in a more negative light), as well as for coloureds and Indians/Asians. A half of blacks gave a positive response, with a quarter each either being negative or giving a “don't know” response. The two Cape provinces show the lowest approval levels.
As the President's approval rating continues to fall, it is clear that, as yet, Jacob Zuma's rating is not yet rising to fill what may be becoming a perceived leadership vacuum: 46% approve of neither man.
Technical note
The studies were conducted amongst a sample of 2 000 adults (1260 blacks, 385 whites, 240 coloureds and 115 Indians/Asians) in the seven major metropolitan areas: they have a margin of error of under 2.5% for the results found for the total sample. The studies were conducted by TNS Research Surveys (Pty) Ltd as part of their ongoing research into current social and political issues and were funded by TNS Research Surveys. For more details, please contact Neil Higgs on 011-778-7500 or 082-376-6312.
Website: www.tnsresearchsurveys.co.za
About TNS
TNS is a global market information and insight group.
Its strategic goal is to be recognised as the global leader in delivering value-added information and insights that help its clients make more effective business decisions.
TNS delivers innovative thinking and excellent service across a network of 80 countries. Working in partnership with clients, TNS provides high-quality information, analysis and insight that improves understanding of consumer behaviour.
TNS is the world's leading provider of customised services, combining sector knowledge with expertise in the areas of Product Development & Innovation, Brand & Communications, Stakeholder Management, Retail & Shopper and Customer Intelligence. TNS is a major supplier of consumer panel, media intelligence and audience measurement services.
TNS is the sixth sense of business™.
www.tnsglobal.com