What is Google Trends and how does it work?
Google Trends is an online tool created by Google to visualise and expose trends in search behaviour in reference to specific search queries or topics users input within Google Search, Google Shopping, YouTube, Google News and Images. The tool allows users to see how often specific search queries, phrases and topics have been queried over a specified period of time. The data is displayed on a timeline to form a trend graph that can be analysed.
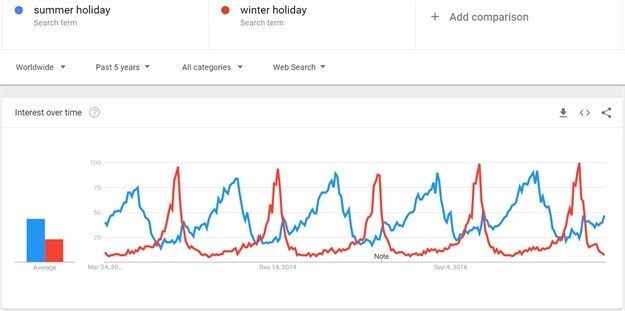
Google Trends does not expose all of Googles data, the tool samples and analyses a portion of search query data to determine how many searches have been conducted for a specific search query and timeframe and plots that on a timeline. One can query up to five different search terms at once which is displayed on a graph for analysis and comparative research. The graph is called the “Search Volume Index”.
How to use Google Trends?
To make use of Google trends, go to https://trends.google.com/trends/. The tool has a variety of different refinement options for your search request. You will be prompted with inputting a topic or search query to explore further. After inputting a desired topic to explore, you are presented with refinement options. These pertain to:
- Location: This can be done at global level all the way down to city level- Timeframe: 2004 till present, up to the past hour
- Search Types: Web, Image, Shopping, News, YouTube
- Category Type: Industries such as automotive, health, home, etc
Google Trends will also display interest by sub-region to show areas where the search topic is most popular. Suggestions in terms of related search queries and topics is also displayed in terms of what is on the rise, or what is seen as the top related queries.
How to interpret Google Trends data and graphs
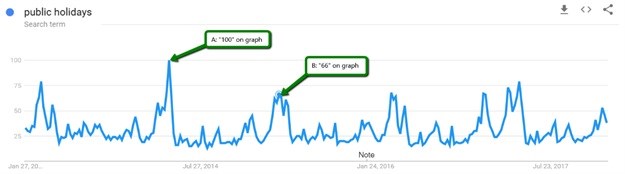
The most important thing to keep in mind when looking at Google Trends, is the Search Volume Index. The graph displayed in Google Trends does not show actual search volume numbers, but rather an index from 0 – 100. Where “100” indicates the most search volume received for that specified time period. Everything else in the time frame is calculated in reference to this point on the graph that receives "100". In the image below, search volume for point B on the graph is 66% in size of search volume compared to that of point A. OR point A is 1.51 times larger than the interest received at point B on the graph.
*For more accurate readings, couple Google Trends information with Google Keyword Planner. This will assist in gauging an idea as to what the real search volume numbers are more likely to be.
Benefits of using Google Trends
With Google Trends being able to visualise the search query data collected within a trending format; there is a host of advantages to this, we take a look at three of these;
Determine the hottest trends
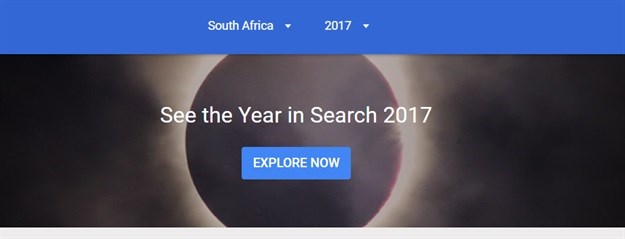
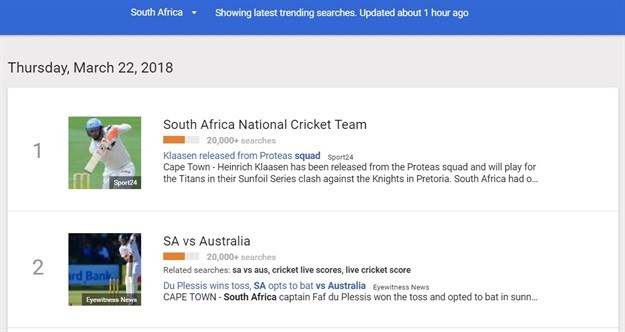
On the homepage of Google Trends, is a breakdown of a variety of different trending information for different countries. This information covers featured insights and stories that are trending. Using this information; hot topics can be determined for the current time period and used to create content and strategies from. It is important to note, for South Africa, this “homepage” does not exist. However, there is “trending searches” and “top charts” which displays similar information that includes South African data.
Brand & marketing performance monitoring
Often above the line advertising (ATL) and general brand awareness can be difficult to ascertain the impact it has had for a brand. Google Trends helps with this by showing the increase in activity or interest shown towards a brand or product. The trend data can be used to cross reference certain events or campaigns and how they have influenced the public to act in a certain way, such as performing a branded search in Google.
If we were to use Takealot as an example (see graph below), we see that there are massive spikes in interest around the same period of time each year. This is during Black Friday, where Takealot received the most interest during the year due to their marketing activities and special offers for Black Friday. As each year has passed, their marketing activities have become more effective around this important shopping day, and this has translated to increased brand interest during this time of the year.
Other ways to ascertain how a brand is performing in terms of interest shown by the public is to conduct different brand searches such as “brand+product” or “brand+service” search, and analyse the results. Important things to keep an eye out for is spikes in interest, peaks, troughs and a drop shown on a graph. This data can be cross referenced with advertising campaigns or activities to determine the impact they have or have not had. This approach can be used for competitor analysis as well.
To note, if there is insufficient data (low search volume terms), Google will not be able to create a graph to show the data.
Maximise budget spend and efficiencies
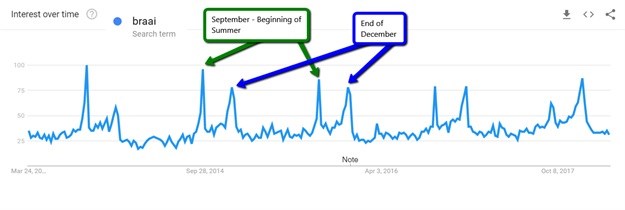
One of the most effective uses for Google Trends is that the tool can be used to more effectively run advertising campaigns with the information available within the tool. To maximise a budget, it helps to be able to target regions more effectively and do so at the right time of the year. In Google trends it is possible to determine seasonality of a particular topic or search query. The example of “braais” has been used below to illustrate this below. There is a clear spike in interest leading up to Summer, and another clear spike close to the end of December. Without fail every year the behaviour is the same. By using this information one can use a targeting strategy that incorporates more aggressive bidding and techniques during these times to maximise exposure when interest is at its highest.
The same applies to geographic locations; where knowing what cities or regions shows the most interest into a particular topic, instead of wasting media budget on cities that are not interested, one can direct budgets to areas where the most interest is shown to spend more effectively.
Google Trends also shows “related queries”, which exposes popular queries related to the topic being searched for. This information can be used to expand on targeting efforts by including these queries when running Google Adwords campaigns for instance.
In conclusion, Google Trends is a very powerful market research tool that can be used by MDs to keep tabs on their brand exposure, all the way down to the specialists using the data to enhance marketing strategies for companies. There is a lot of information that can be taken from the tool and effectively put to work to improve marketing strategies and gain valuable market research insights. Next time you are looking to find out more about a certain topic, or want to know how a brand is performing in the eyes of the consumer, head over to Google Trends and start searching!
About the author:
Aidan has been involved in the digital world in one form or another since 2007. He has worked in the mobile gaming industry, web development and digital strategy which led him into a career within SEO. Through this experience, he gained valuable insights into different industries and SEO tactics to best target potential users for many different companies. Aidan has a great passion for knowledge sharing and enjoys equipping others in understanding what SEO is, and how it can help different digital specialties.