We started our journey into effective SEM segmentation by suggesting that inertia is not an option and that it is only by using all the available data that we will be able to calibrate new segmentation benchmarks.
Media planning is undoubtedly all about market segmentation. Marketing managers can grow their product and brand slice of the market by basing their media strategies on this intelligence, as it points to which market segment to communicate, for a better chance at volume.
Using SEM cluster segmentation to navigate through all the open source industry data provides us with agile insights and the reassurance that the revised socio-economic segmentation variables continue to show a consistent interpretation of the South African marketplace and media landscape.
In this article, we scratch the surface of what this can mean for products and brands, by discovering some market realities in sample categories of beverages, banking as well as food and groceries.
Growing fusion adoption for growth strategies
When it comes to FMCG product and brand information, the release of the four-way multi-fusion database Fusion 2020 filled many of the gaps left by the demise of Amps in 2016.
In an earlier module we reviewed the importance of data fusion in aggregating insights across multiple studies. This is particularly valid when we combine data from studies that capture longitudinal insights. That is to say actual behavioural data captured over a number of days, weeks or even months, rather than the traditional SESS (single event single source) questionnaire ‘snapshot’, which harvests a respondent reply once at a fixed point in time.
In the case of digital media, this might derive from using cookies for measurement of social media features or to analyse traffic. In the case of television viewing, these longitudinal insights come from Tams Peoplemeters, which capture and report real-time viewing behaviour.
In this instance the branded FMCG information in Fusion 2020 derives from Nielsen Consumer Panel Services (CPS) or as it is sometimes known as, the Nielsen Home Panel.
In South Africa, the panel consists of 4,000 households that are audited monthly on actual purchases for the year. Using a systematic overlay of barcode scanning, cross-referenced with till slips and bin-audits, this equates to more than 210,000 actual ‘purchase events’ during the course of the year.
As such, CPS audited data provides a really accurate mirror of actual market share at any point.
Based on CPS data, the Fusion 2020 database reports on 191 FMCG categories and 2,200 brands (light, medium and heavy consumption) as well as Pams-branded information on retail outlets (food and groceries/clothing/furniture and appliances), financial institutions and motor vehicles.
Household SEM truths from banking to beverages
In an earlier module, we saw that the inflexion point from ‘unbanked’ to ‘banked’ was a good indicator of an individual being both employed and economically active in the formal sector.
Using Fusion 2020 data, we are now able to evaluate this engagement with the banking sector at a branded level. Capitec is the financial institution with the largest footprint in every SEM segment, with the exception of SEM_C5 where Absa is the largest brand.
In the retail sector, we find similarly reassuring patterns.
When it comes to food and groceries, Boxer Super Stores and Cambridge Food are well positioned against the lower end SEM_C1 and SEM_C2. At the top end, Woolworths retains pole position against SEM_C5 with Food Lovers Market and Checkers/Checkers Hypermarket beginning to provide competition in that space. Checkers is presumably competing in this space with its new FreshX concept stores.
When it comes to buying clothing the SEM model again reflects the data’s ability to provide a reassuring representation of the retail market. We see Woolworths dominating in SEM_C5 but with increased competition from Cape Union Market. As expected Pep Stores, Ackermans and Jet are well positioned at the lower end of the market with Mr Price dominating the middle market. Unexpected entrants to this clothing market segment are Clicks and Dischem.
Yet it is the granularity of data at the product and brand level that generates tremendous value. While it is not feasible to unpack detailed insights across all 2,000 brands in Fusion 2020 data in one article, we can illustrate the robust versatility of SEM segmentation by a topline evaluation of the CSD (carbonated soft drinks market).
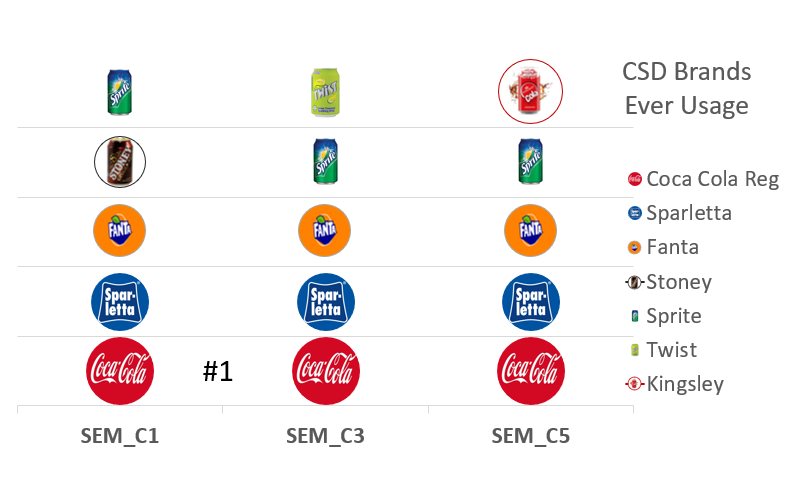
Looking at a simple selection of the SEM clusters we can see that the leading brands Coca Cola, Sparletta and Fanta are predictably reported in the top three positions but the robustness of the data is illustrated by the shifts in branded CSD consumption amongst smaller brands.
In SEM_C1, the first challenger brand in at number four is Stoney Ginger Beer. From SEM C_3, Sprite claims that position with Twist knocking Stoney out of the top five brands. In SEM_C5, the surprise entry into the big five is Kingsley. Also displacing Stoney and Twist in the top five ranking.
The breakdown of branded insights by light, medium and heavy consumption provides an additional layer of valuable data for segmentation and planning purposes.
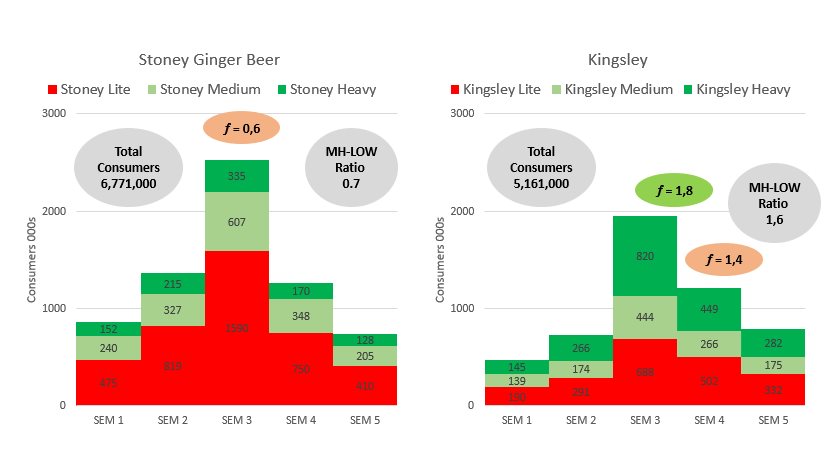
Once again within the CSD market we can evaluate two of our challenger brands in terms of determining relative strengths and weaknesses. Both Stoney Ginger Beer (6,7 million consumers) and Kingsley (5,1 million consumers) show a strong volume contribution from SEM_C3 and a diminishing contribution to sales at both extremes of the market.
The most interesting and functional narrative is delivered by evaluating the ratio of medium-heavy users relative to light users.
Stoney has a negative power ratio (ƒ = 0,7) which means more focus is required on driving consumption volume amongst existing users. This is particularly noteworthy in SEM_C3. In this SEM segment, which is the single biggest contributor to volume for the brand, the power ratio is lowest (ƒ = 0,6). In terms of media planning segmentation this might suggest a need to focus media into this SEM_C3 segment.
Kingsley has a power ratio of ƒ = 1,6. This is at its highest (ƒ = 1,8) in SEM_C3. In simple terms trial is more likely to be converted to regular consumption. From SEM_C4, however, this ratio declines rapidly (ƒ = 1,4) and although this is still a positive yield, it does suggest a need for communication into this SEM_C4 segment.
Using global best practice data fusion techniques, this dataset is growing in both representation and functionality each year. When it comes to new data and research, there is only one real option open to advertising strategists and media planners in South Africa. Use it or use it!
Contact us here>
About the Ebony+Ivory Marketing Segmentation South Africa Series
Drawing data and insights from the most recently published industry database Pams_2019 (released April-2020) and the Nielsen Fusion Study 2020 (released November_2020), we interrogate the SEM model through four lenses: People and places, purchasing power, products and platforms.